Q1 2026 Market Commentary: A Wild and Wacky Year Sets Up Another Wild and Wacky Year
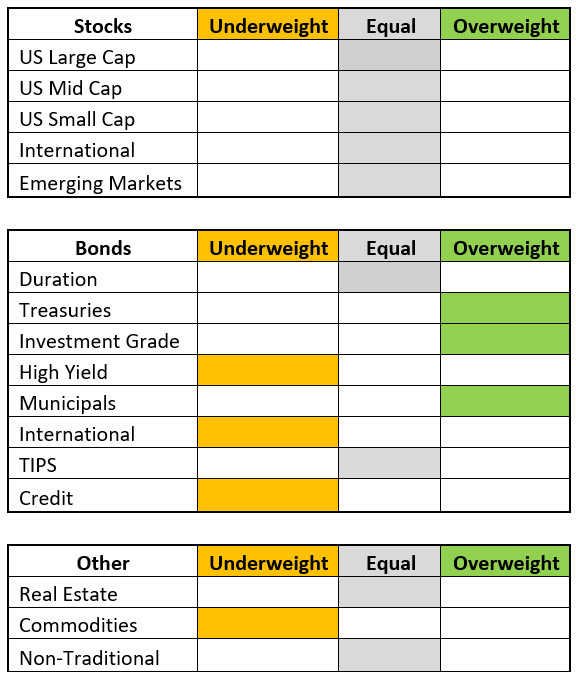
This information is meant to be a commentary regarding Consilio Wealth Advisors’ views on the relative attractiveness of different areas of the market, contrasted with our current asset allocation strategy for the near term, 12-18 months.
These views are always made in the context of a well-diversified portfolio and are not meant to be a recommendation to buy into or sell out of a particular area of the market. These views can and will change as new information becomes available, and we will periodically update this brief to keep you informed of changes.
Year in Review
This is a gentle reminder that the Nasdaq and S&P500 experienced sharp sell offs in March and April because of tariffs, which are still in place to this day.
In what seems like ages ago, “Liberation Day” is treated as a relic of the past by markets. The average tariff rate is currently 16.5% with the effective rate standing at 14.4%. The effective rate accounts for shifting purchases or consumers forgoing purchases because the imported price is too high. It is estimated that tariff revenue will be over $200 billion for 2025.
It could also be likely that even if Trump were to leave office, his successor would keep most of the tariffs in place. Call us cynical, but politicians love tax revenue. Ironically, the One Big Beautiful Bill offers tax cuts without reducing spending, leaving the Federal budget in deficit. The tariff revenue only partially offsets our spending.
As of this post, the legality of the tariffs without congressional approval is still being reviewed by the Supreme Court.
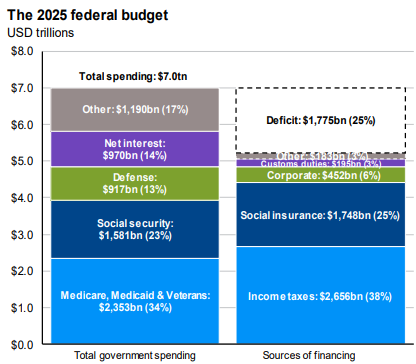
The chart above (JP Morgan “Guide to the Markets” as of 12/31/2025) shows we’re expected to spend $970 billion on interest expenses alone. It is estimated to be over one trillion dollars in 2026. The total debt with 2025 included will reach $38 trillion.
Lost in the shuffle was how great a year international markets had compared to a pretty good year in US markets.
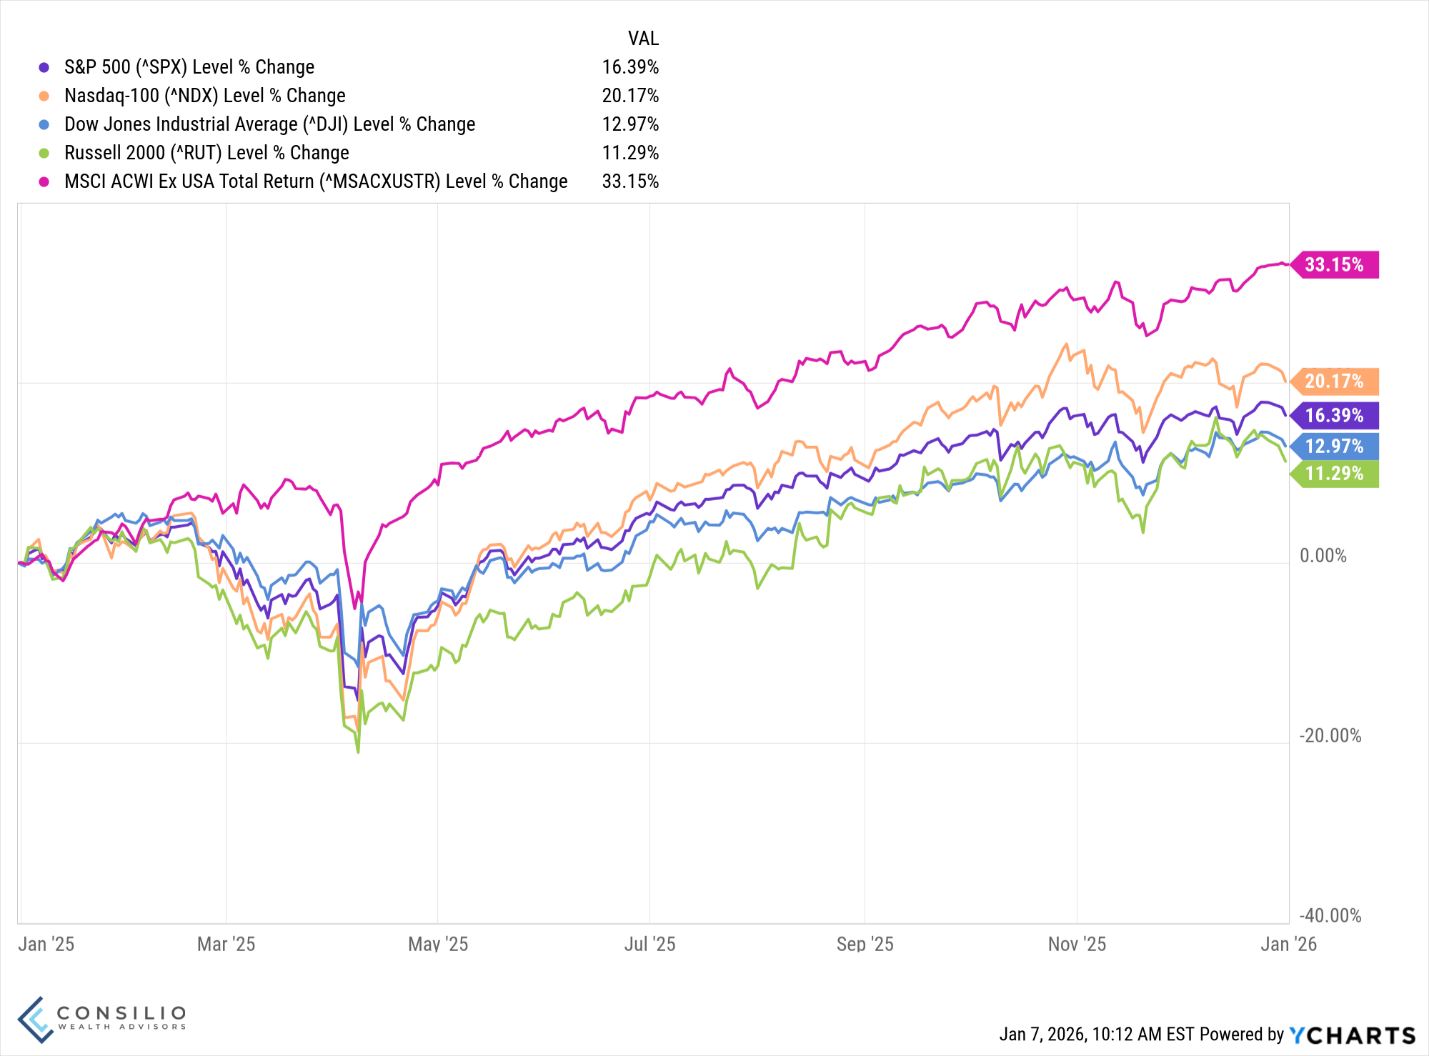
US markets are not the only game in town. Even though the S&P500 enjoyed another good year, international markets finally started to show life. Even with this blockbuster year, international stocks still have a long way to go to catch up.
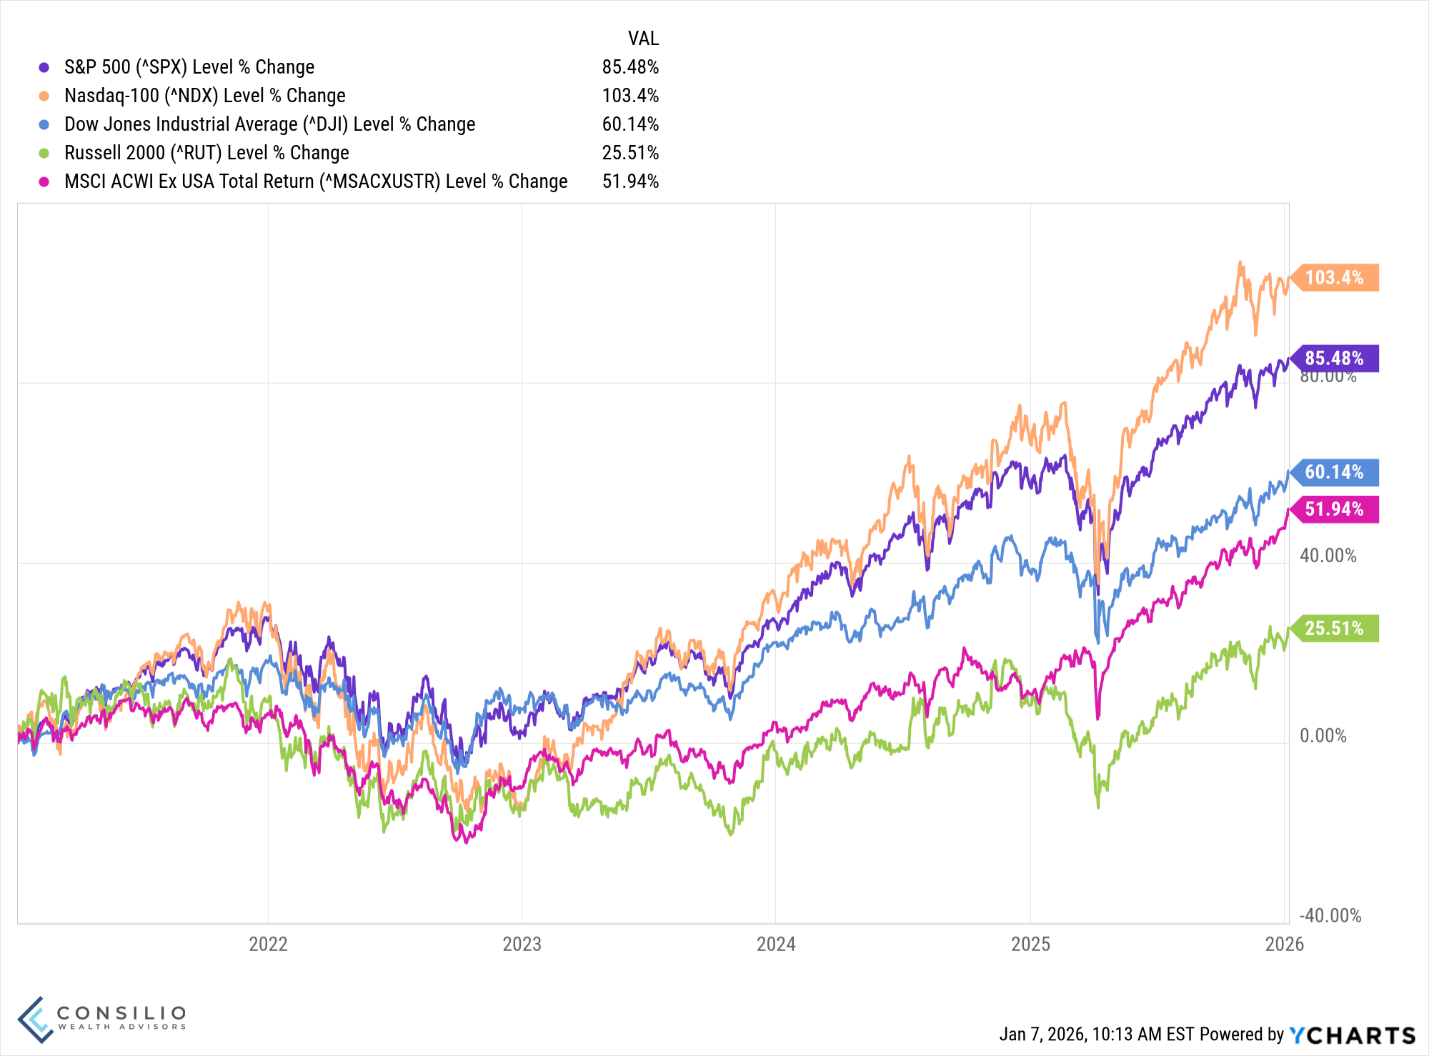
Looking back five years, international markets are up less than half of the Nasdaq and are lagging the S&P500 by more than 30%.
Another Government Shutdown
Inflation came in much lower than expected for November data because it wasn’t being collected in the first half of the month. When the government reopened and data collection resumed, it was right into the holiday sales period. If you believe that companies raise prices right before they bring them back down for holiday sales, the government conveniently missed the high-priced window.
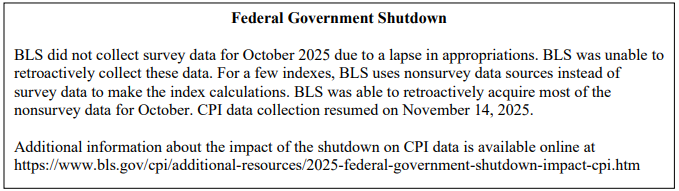
The Bureau of Labor Statistics doesn’t take survey data, rather they use hard data to measure prices. When data isn’t being gathered, they have no methodology to fill in any gaps. Makes sense if the goal is to measure prices versus how people or businesses feel about prices.
The Economy
Lots has been said about the K-shaped economy, meaning the upper arm of the K is doing much better. The bottom arm (the leg?) of the K is much worse. It’s seemingly everywhere.

It feels like businesses are increasingly catering to higher-end (higher margin?) consumers, and everyone else has to fight for scraps. Unit margin economics argues that companies should be okay with selling less volume if their margins are healthy. Why sell someone space on a place for $100 when you can sell that same space for $1000? Even if that $1000 isn’t always booked, you’d need to sell ten $100 just to match.
Another way to look at it is under the lens of an evolving economy. Despite tariffs, services are growing while manufacturing is contracting. We don’t make stuff anymore, but we are providing more in services.
Here we explore differences in manufacturing versus services.
Manufacturing PMI
Survey of purchasing managers in manufacturing firms (auto, machinery, electronics, apparel, etc.).
Key components typically include new orders, production/output, employment, supplier delivery times, and inventories.
Above 50 = expansion in manufacturing, below 50 = contraction, 50 = no change.
Services PMI
Survey of purchasing managers/executives in service industries such as financial services, health care, retail, transport, hospitality, and professional services.
Tracks business activity, new business, employment, input prices, prices charged, and expectations in the services sector.
Same 50 threshold logic: above 50 suggests expansion of the services sector, below 50 suggests contraction.
Below is a chart that measures expectations of managers in various industries giving their near-term outlook on business prospects. Are they optimistic and ordering more raw goods in advance of a big year? Or are they pessimistic and slowing their orders?
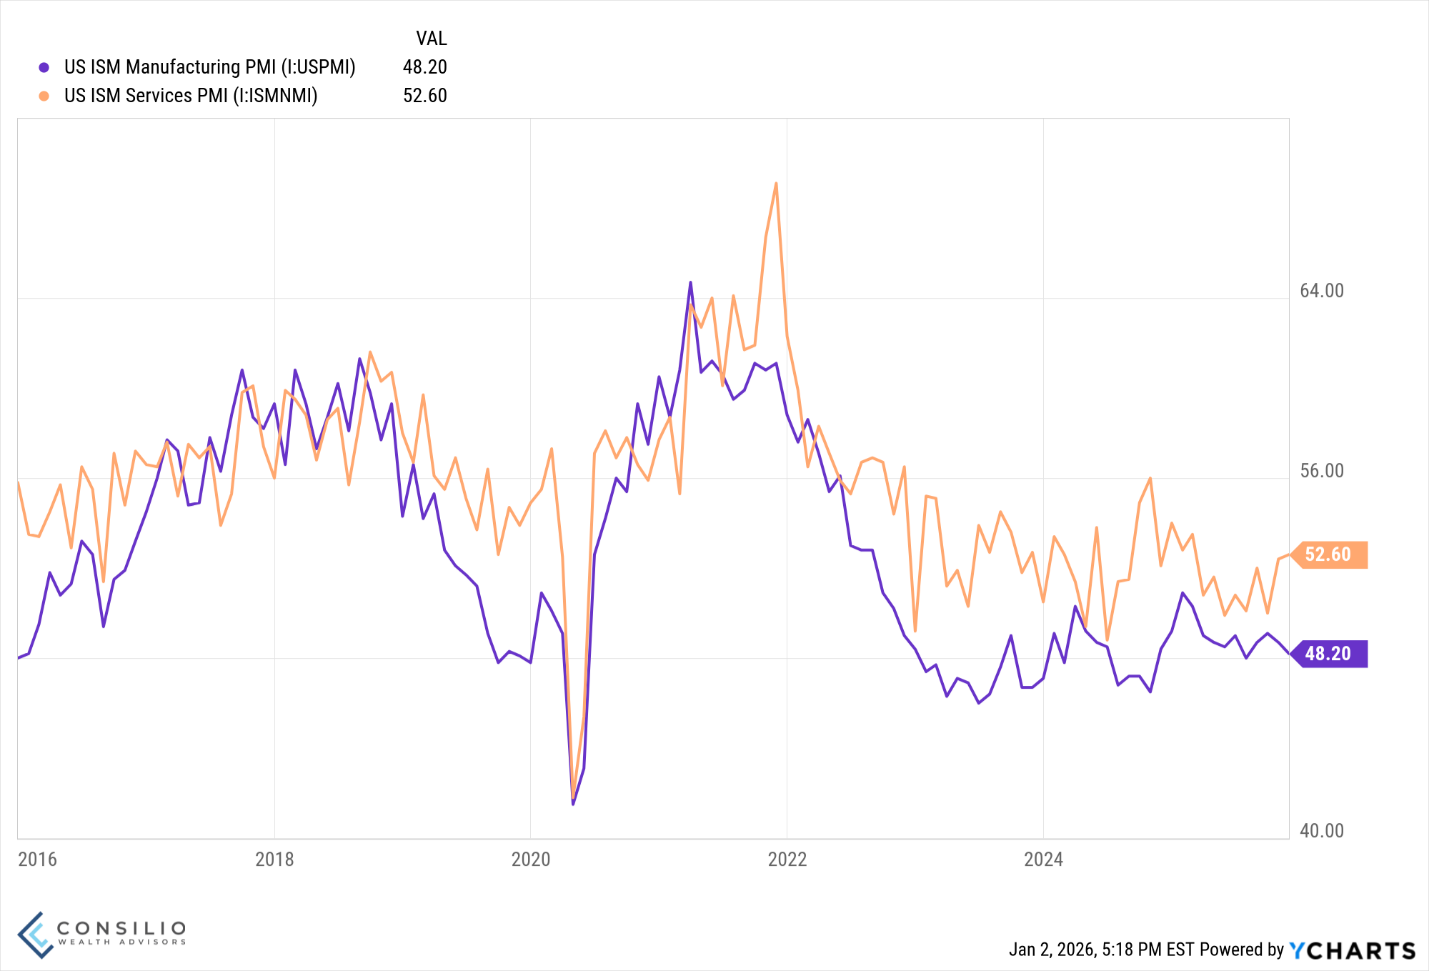
Manufacturing is showing contraction while services is registering pretty strong growth. More K shapes. This is nothing new though. The US economy has transitioned to services over the past 4 decades. Service jobs outnumber manufacturing to the tune of 9:1.
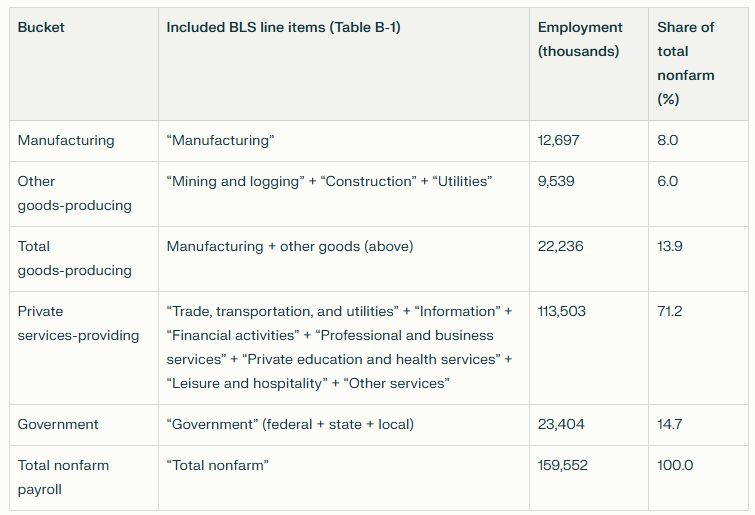
All figures are from BLS Employment Situation, November 2025 (seasonally adjusted).
Maybe we’ve always had a K-shaped economy, one where there are winners and losers. We don’t know if this is ultimately sustainable, but the ebbs and flows seem to produce newly minted winners.
Looking Ahead to 2026
We think the economy will continue to grow, but jobs may not be as plentiful as they were in 2022 and 2023. The unemployment rate is at 4.4% and we think it is unlikely that it will jump significantly higher, especially as the Fed anticipates more rate cuts. Lower interest rates tend to help the economy. Demographics are also a consideration with the aging population.
The AI boom isn’t quite dead yet, and while we think it’ll be difficult to pick a winner now, the AI basket does look bright. As with emerging technologies, there will be winners and losers. Instead of trying to predict the future winner, own the whole basket.
Wall Street is forecasting about +10% gain for the S&P500 in 2026, marking a possible fourth year in a row with double-digit gains. The last time we had this much consensus, it was heading into 2023, where nearly every forecast was negative. 2023 was +26%. In other words, no one knows the future, especially the herd. This isn’t a cop out for our part, forgoing forecasts or even venturing a guess. It doesn’t help investors.
Taking a long-term look, the market has an upward bias, being up about two-thirds of the time. We don’t know when a bad year will hit, but looking at the probabilities, it’s more likely that the market will go up on a yearly basis.
There will be lots of noise, however. Don’t let politics and politicians ruin your investment track. With midterm elections upcoming, the volume of the noise will be dialed way up. Trump will likely ratchet up his administration’s goals this year because it is looking like the House may flip, creating a split Congress. That would all but cement a lame duck presidency for the remainder of the term.
DISCLOSURES:
The information provided is for educational and informational purposes only and does not constitute investment advice and it should not be relied on as such. It should not be considered a solicitation to buy or an offer to sell a security. It does not take into account any investor's particular investment objectives, strategies, tax status or investment horizon. You should consult your attorney or tax advisor.
The views expressed in this commentary are subject to change based on market and other conditions. These documents may contain certain statements that may be deemed forward looking statements. Please note that any such statements are not guarantees of any future performance and actual results or developments may differ materially from those projected. Any projections, market outlooks, or estimates are based upon certain assumptions and should not be construed as indicative of actual events that will occur.
This document is for your private and confidential use only and not intended for broad usage or dissemination.
No investment strategy or risk management technique can guarantee returns or eliminate risk in any market environment. All investments include a risk of loss that clients should be prepared to bear. The principal risks of CWA strategies are disclosed in the publicly available Form ADV Part 2A.
Index returns are unmanaged and do not reflect the deduction of any fees or expenses. Index returns reflect all items of income, gain and loss and the reinvestment of dividends and other income. You cannot invest directly in an Index.
Past performance shown is not indicative of future results, which could differ substantially.
Consilio Wealth Advisors, LLC (“CWA”) is a registered investment advisor. Advisory services are only offered to clients or prospective clients where CWA and its representatives are properly licensed or exempt from licensure.