
Q3 2026 Market Commentary: The Bull Market Keeps Charging Higher. Is it Expensive?
This information is meant to be a commentary regarding Consilio Wealth Advisors’ views on the relative attractiveness of different areas of the market, contrasted with our current asset allocation strategy for the near term, 12–18 months. These views are always made in the context of a well-diversified portfolio and are not meant to be a recommendation to buy into or sell out of a particular area of the market. These views can and will change as new information becomes available.
Our Current Positioning
Below is our near-term asset allocation view for the next 12–18 months. The commentary that follows explains the thinking behind these weights.
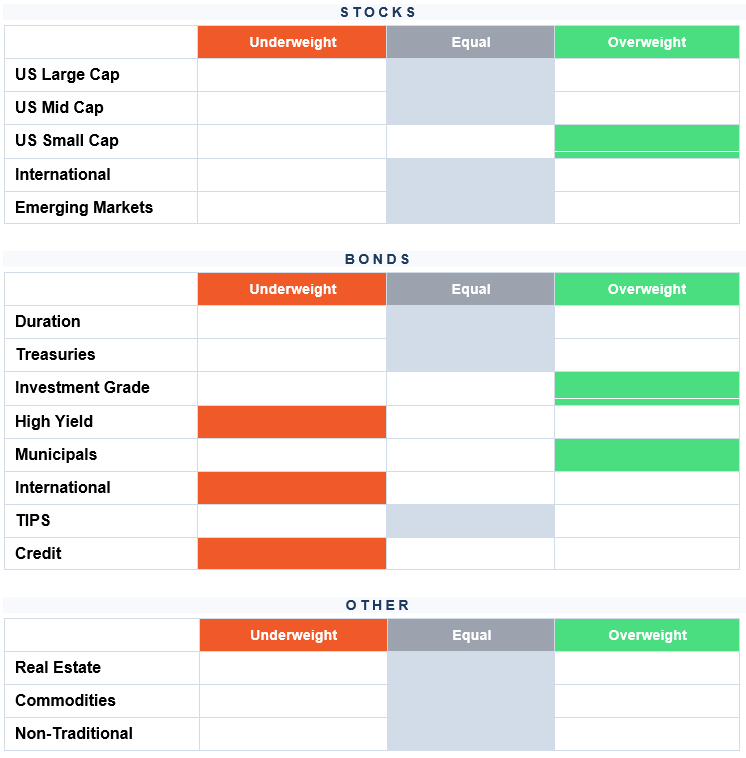
Views reflect Consilio Wealth Advisors’ near-term (12–18 month) positioning as of Q3 2026. Subject to change as conditions evolve.
Quarter in Review
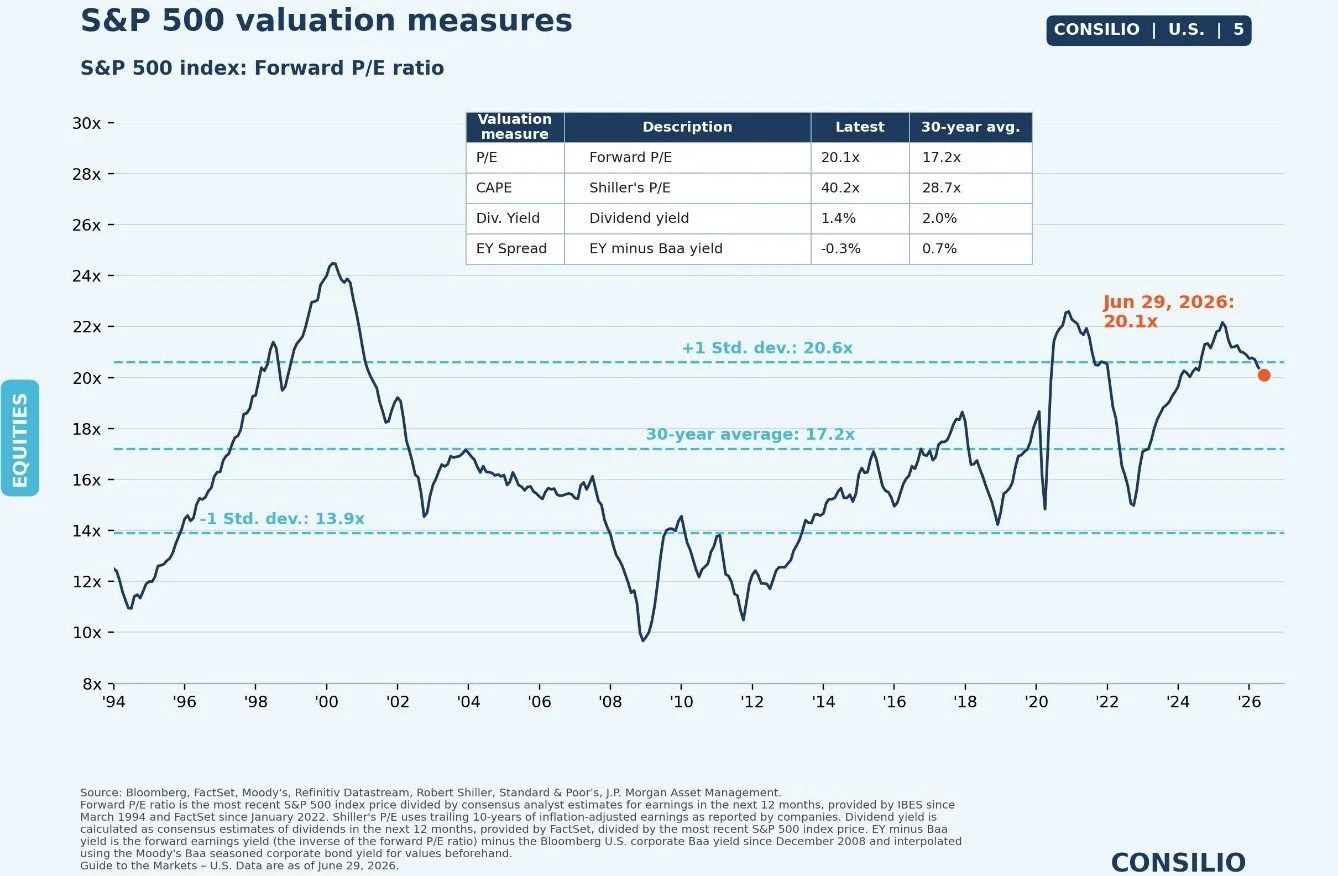
Is the market expensive? According to traditional valuation methods, PE ratios (the amount of premium paid for every dollar of profit), it is. The last time the market had reached these levels, it was in 1997. Yes, there were few people screaming about valuations, but you had to wait until 2001 until those doomsday predictions were right. Granted, the high-flying stocks from 2000 had very little profits to show compared to today’s leaders, the market’s price to earnings ratio typically does point toward lower expected performance. It’s just harder to grow trillions as opposed to growing billions of dollars.
The chart below measures how much premium it takes to invest in $1 of profit. When the ratio dips or when the premium goes down, it’s normally associated with bad news, the dotcom bust, the great housing crisis, etc.
Just look at the Magnificent 7 this year through June 29th. Great past performance usually brings along higher expectations. Most of the Mag 7 companies have beat earnings expectations, but have little to show for it in their stock prices this year.
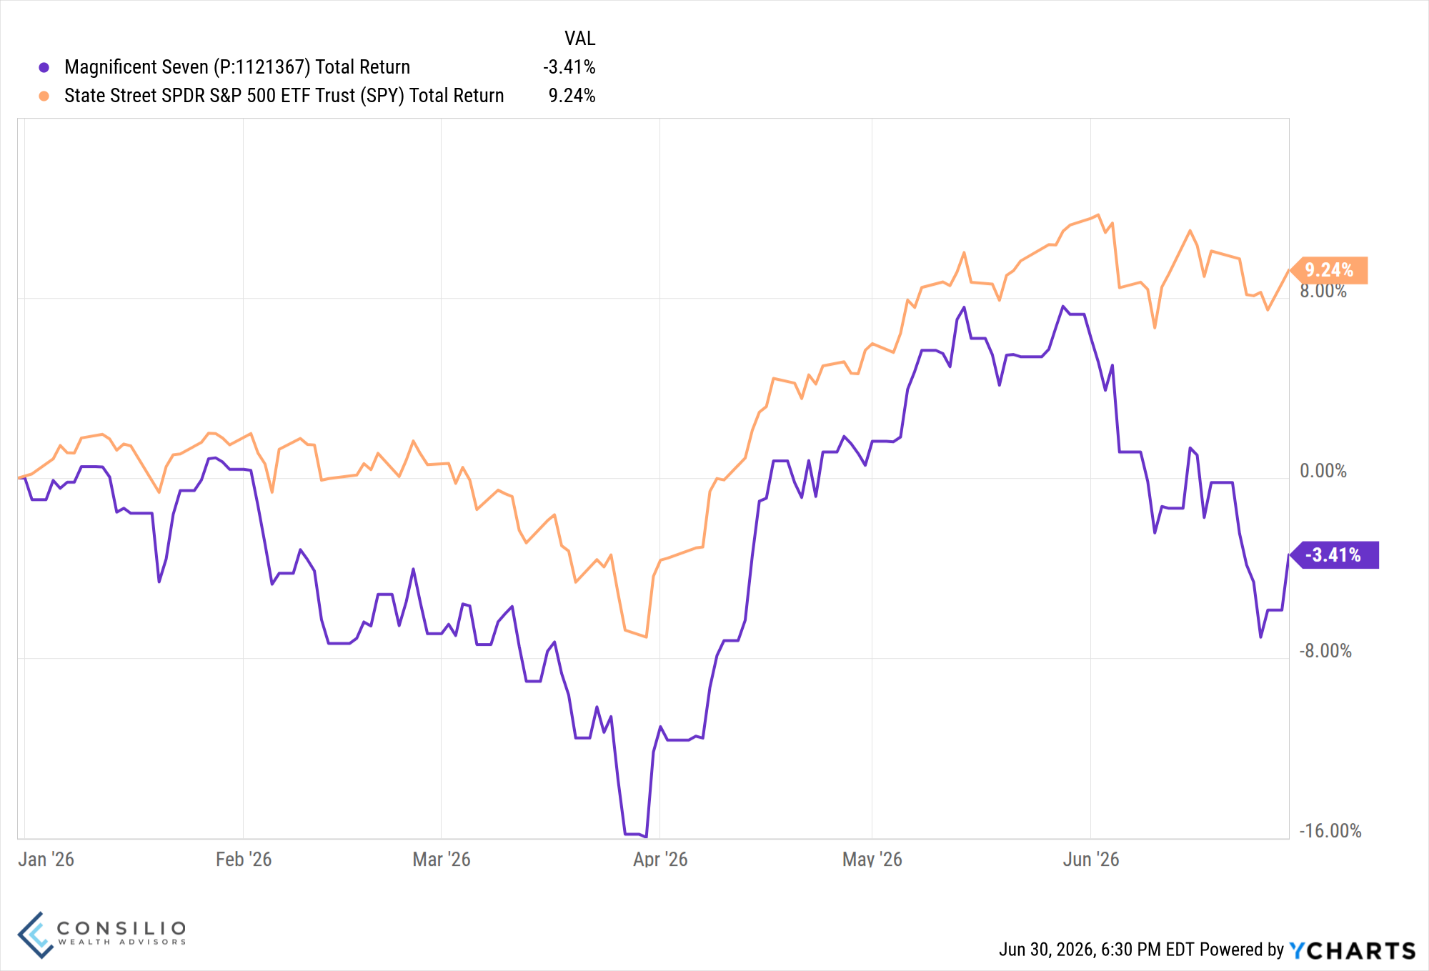
The Mag 7 companies aren’t failing, far from it. They’re beating earnings estimates and these businesses are still growing. Yet, the market remains unimpressed. It’s like all the momentum has been sucked out of the past winners.
What’s happening is a rotation into other names, specifically semiconductors (using SOXX ETF as a proxy) and memory chips (DRAM) are getting a lot of attention.
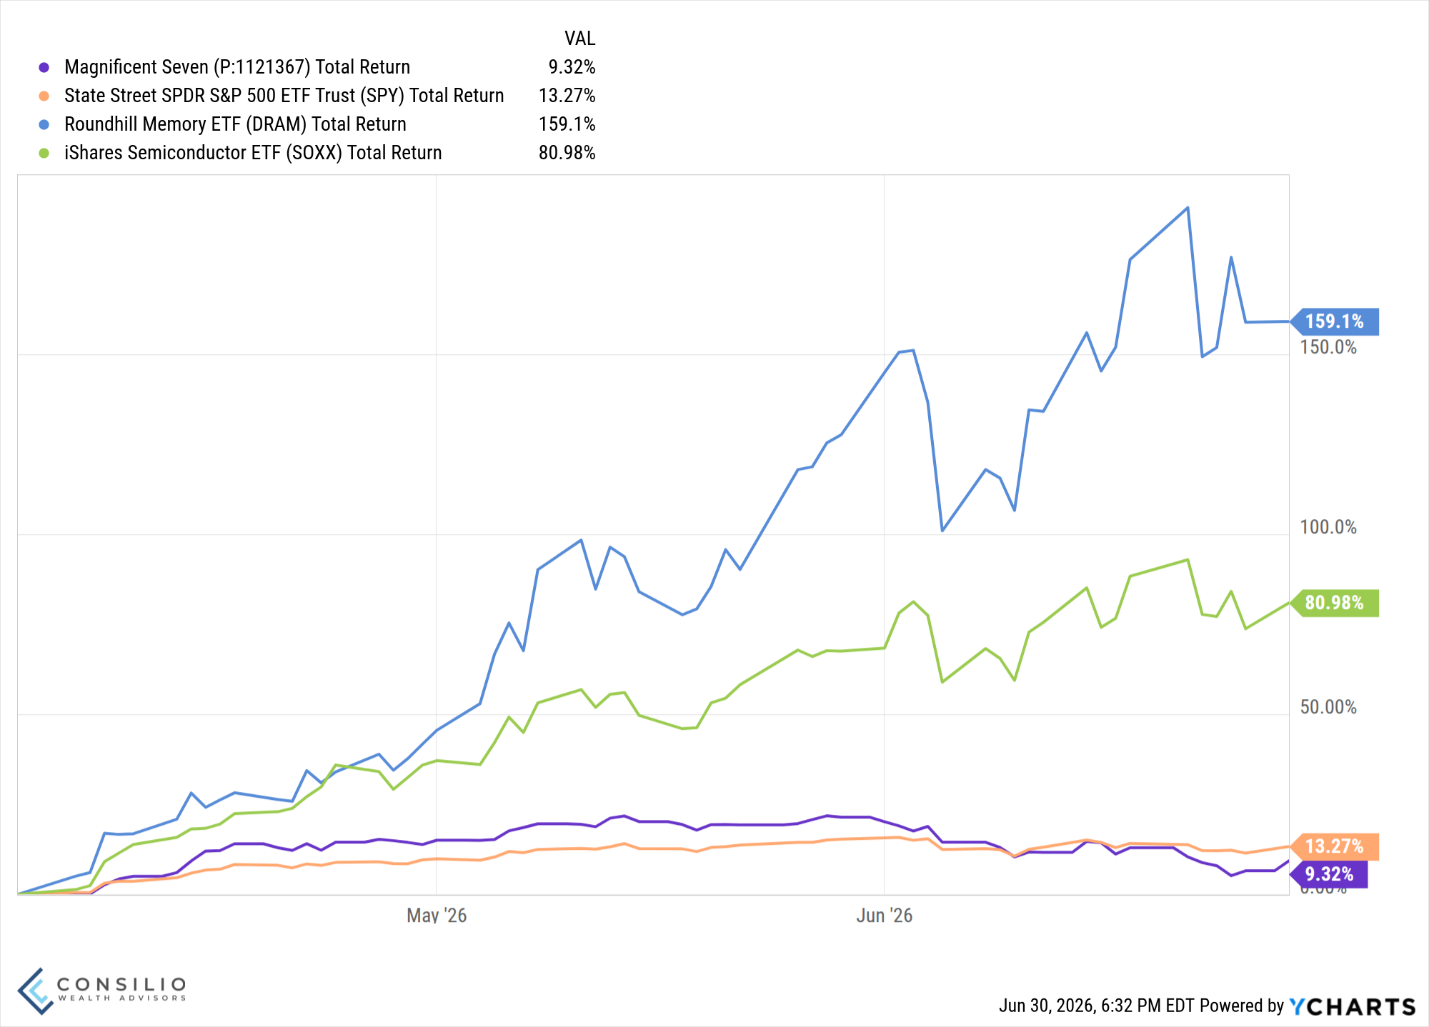
DRAM is up 159% this year alone (through June 29th). The companies in the index have experienced incredible demand from the datacenter buildout. So, the performance so far has been broadly warranted. There’s a massive backlog for memory chip production and as long as demand remains elevated, these companies are expected to keep raising their prices. Videogame players can attest to massive price increases for their hardware.
The AI trade is alive and well, it’s just benefiting other companies now. As with the Mag 7, today’s winners are showing growing profits and revenue. Talk of another dotcom bubble looks premature and little in common with the tech bubble. Sure, the demand for data centers may fade as they’re getting more and more expensive to build. Throw in community pushback and you might have a real bottleneck to high paced buildout.
Where today rhymes with 2000
| Dimension | Dot-com / telecom (1995–2000) | AI today (2026) |
|---|---|---|
| Massive infrastructure capex on faith | Cumulative telecom investment well over $500B | Hyperscaler 2026 capex consensus ~$519B |
| “Supply creates demand” thesis | Build the capacity and the uses will follow. | Same logic underpins the data-center buildout: build the compute, monetization follows. |
| Overcapacity is the core risk | Networks raced ahead of demand; four years post-crash, 85–95% of fiber stayed “dark.” | Open question: are data centers being overbuilt ahead of real, paying AI demand? |
| A genuine, transformative technology | The internet was real and reshaped the economy — the tech wasn’t the fraud, the financing was. | AI is a real productivity technology; few serious skeptics dispute the underlying capability. |
| Infrastructure outlives the bust | The fiber glut cut bandwidth costs ~90% and enabled the next wave (e.g., YouTube). | Even bears concede overbuilt data centers and power become a usable asset in a downturn. |
Where today breaks from 2000
| Dimension | Dot-com / telecom (1995–2000) | AI today (2026) |
|---|---|---|
| Profitability of the leaders | The dot-coms were unprofitable; the IPO was the exit. | Today’s leaders generate real profit — Mag 7 at 25%+ net margins vs. the S&P’s ~13%. |
| Valuations | Nasdaq P/E hit ~200 at the peak; Cisco traded near 472x earnings. | Mag 7 at ~28x forward, about half the dot-com tech multiple; Nvidia ~24–26x forward. |
| How it’s financed | Heavily debt-financed; borrowers couldn’t service debt once funding dried up. | Funded largely from hyperscaler operating cash flow, not leverage — far less fragile. |
| Who’s building | Thinly capitalized startups and overstretched telecoms (WorldCom, Global Crossing — both bankrupt). | Cash-rich incumbents (Microsoft, Alphabet, Amazon, Meta) with earnings to absorb a miss. |
| Where the speculation hides | Public equities — retail bought the froth directly. | Pure-play AI names are largely private or capped-profit vehicles — risk sits more in private markets. |
| The bottleneck’s direction | Capacity was overbuilt ahead of demand → glut. | Supply is the constraint: GPU-poor, power-poor, and now community / permitting pushback. |
The SpaceX IPO
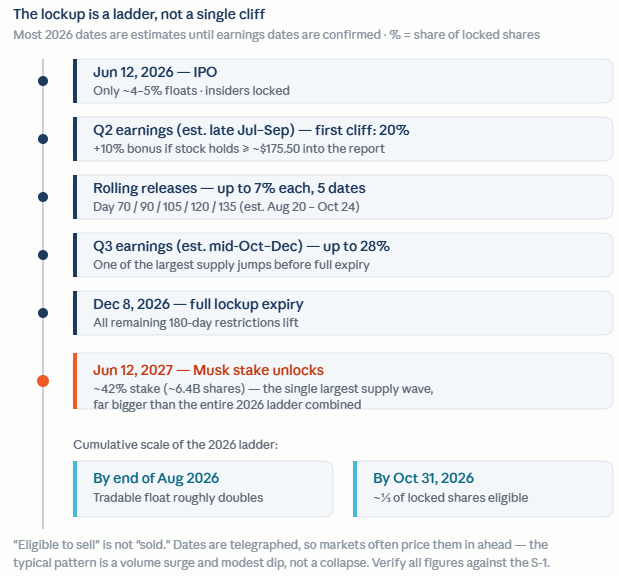
Many consider the SpaceX (SPCX) IPO a success but sustainability of the pop is in question given the unique nature of the lock ups expiring over time versus a traditional lock up period for other IPOs. A traditional lock up forces insiders and early investors to hold their shares for six months after an IPO. Once six months pass, they’re free to sell.
In SpaceX’s case, the lock up is a gradual release to keep the stock price up or at least stable. Typical IPOs experience a lot of volatility, especially when investors all know when the lock up window expires. Insiders and employees will be allowed to sell gradually, with the last holder being Elon Musk, who has a one year lock up.
The Fed: New Leadership
Kevin Warsh has taken the wheel at the Fed and the first decision under his leadership was a widely expected pause in rates. The surprise was how resistant to cuts the voting members were, given the latest CPI inflation readings at 4.2%. The guy nominated to go in and cut rates has very little support for any cuts, rather there are more Fed members who potentially want higher rates. Higher rates.
Warsh has quite a long history with the Fed and it’s well publicized his position on inflation. He was notably against quantitative easing post housing crisis, citing inflation. This is often referred to as hawkish. Despite Trump wanting lower rates, it does look likely that this new Fed makeup won’t blindly lower rates. They need the data to support cuts, first being inflation needs to be much lower.
Lower rates tend to increase spending broadly, and that’s the last thing you want to do when prices are rising. Increasing demand could make inflation worse.
If this leopard were to successfully change his spots, and become a rate cutting advocate, he can’t do it alone. There are 11 other voting members he needs to sway or replace to get a majority. Absent that, he can talk to the public (something he’s vowed to do less of) or wait for the inflation data or employment data to cool enough to truly warrant a rate cut.
Why talk less? The school of thought is any talk could inadvertently lock the Fed into a path that it needs to pivot away from. Because apparently, if you say you’re going to do something, you must follow through. There’s no room for adjustment if you said something but the data changes or the environment changes. (Sarcasm)
Emerging Markets Driven by the AI Buildout
Two companies make up nearly half of the South Korean stock market (SK Hynix and Samsung), which has profited from semiconductor demand. Side note – the Vanguard Emerging Markets ETF and mutual funds do not consider South Korea as an emerging market country. The Vanguard Developed International Markets ETF and mutual funds do include South Korea. The Blackrock iShares investments include South Korea in emerging markets and not in developed markets. It is important to know what you own. You might be inadvertently underexposed to South Korea or double exposed, depending on your mix of Vanguard and iShares funds.
Based on how you view the AI buildout, this can be a promising development in non-US investments. We hear about data centers (good and bad) and think it’s a US only phenomenon. The rest of the world is homed in on AI advancements, especially China. If the build out is overblown, emerging markets could represent a risk. It’s all a risk, but the performance of emerging markets has been concentrated on essentially two companies in a single country.
Looking Ahead to the Rest of the Year
If history were an indicator of what’s ahead, the strong first half does set up for a good second half. While this could be an oversimplification, investors tend to herd together. Whether it’s FOMO or true market fundamentals, up markets typically create more up markets.
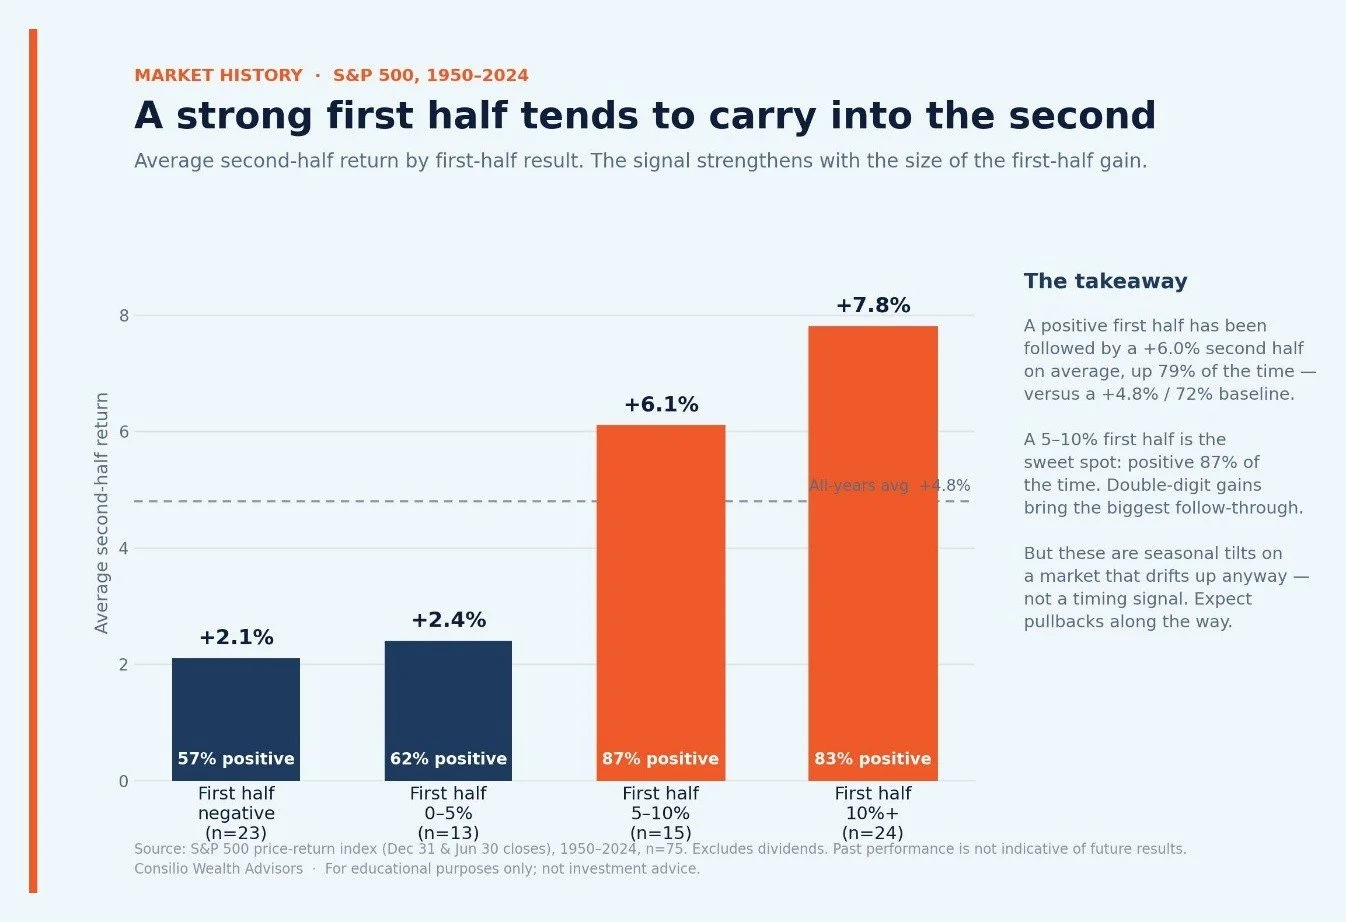
There might be concerns given the market is at all-time highs. There always are concerns, it’s why it’s called the “wall of worry” but the loud voices (sometimes in our own heads) have cost investors a lot of upside. Look back through the decades and there have always been reasons to sell, yet the market averages 16 new all-time highs a year.
There is also plenty of headline risks like the war in Iran, the Strait of Hormuz, gas prices, and inflation. Most of these known risks go away once the war in Iran is settled. These risks have been present since March, yet the market still charged higher in April and May and June.
DISCLOSURES
The information provided is for educational and informational purposes only and does not constitute investment advice and it should not be relied on as such. It should not be considered a solicitation to buy or an offer to sell a security. It does not take into account any investors particular investment objectives, strategies, tax status or investment horizon. You should consult your attorney or tax advisor. The views expressed in this commentary are subject to change based on market and other conditions. These documents may contain certain statements that may be deemed forward-looking statements. Please note that any such statements are not guarantees of any future performance and actual results or developments may differ materially from those projected. Any projections, market outlooks, or estimates are based upon certain assumptions and should not be construed as indicative of actual events that will occur.
This document is for your private and confidential use only and not intended for broad usage or dissemination. No investment strategy or risk management technique can guarantee returns or eliminate risk in any market environment. All investments include a risk of loss that clients should be prepared to bear. The principal risks of CWA strategies are disclosed in the publicly available Form ADV Part 2A. Index returns are unmanaged and do not reflect the deduction of any fees or expenses. Index returns reflect all items of income, gain and loss and the reinvestment of dividends and other income. You cannot invest directly in an Index. Past performance shown is not indicative of future results, which could differ substantially.
Consilio Wealth Advisors, LLC (CWA) is a registered investment advisor. Advisory services are only offered to clients or prospective clients where CWA and its representatives are properly licensed or exempt from licensure.
Underweight | Equal | Overweight US Large Cap US Mid Cap US Small Cap International Emerging Markets Underweight | Equal | Overweight Duration Treasuries Investment Grade High Yield Municipals International TIPS Credit Underweight | Equal | Overweight Real Estate Commodities Non-Traditional Dimension | Dot-com / telecom (19952000) | AI today (2026) Massive infrastructure capex on faith | Cumulative telecom investment well over $500B | Hyperscaler 2026 capex consensus ~$519B Supply creates demand thesis | Build the capacity and the uses will follow. | Same logic underpins the data-center buildout: build the compute, monetization follows. Overcapacity is the core risk | Networks raced ahead of demand; four years post-crash, 8595% of fiber stayed dark. | Open question: are data centers being overbuilt ahead of real, paying AI demand? A genuine, transformative technology | The internet was real and reshaped the economy the tech wasnt the fraud, the financing was. | AI is a real productivity technology; few serious skeptics dispute the underlying capability. Infrastructure outlives the bust | The fiber glut cut bandwidth costs ~90% and enabled the next wave (e.g., YouTube). | Even bears concede overbuilt data centers and power become a usable asset in a downturn. Dimension | Dot-com / telecom (19952000) | AI today (2026) Profitability of the leaders | The dot-coms were unprofitable; the IPO was the exit. | Todays leaders generate real profit Mag 7 at 25%+ net margins vs. the S&Ps ~13%. Valuations | Nasdaq P/E hit ~200 at the peak; Cisco traded near 472x earnings. | Mag 7 at ~28x forward, about half the dot-com tech multiple; Nvidia ~2426x forward. How its financed | Heavily debt-financed; borrowers couldnt service debt once funding dried up. | Funded largely from hyperscaler operating cash flow, not leverage far less fragile. Whos building | Thinly capitalized startups and overstretched telecoms (WorldCom, Global Crossing both bankrupt). | Cash-rich incumbents (Microsoft, Alphabet, Amazon, Meta) with earnings to absorb a miss. Where the speculation hides | Public equities retail bought the froth directly. | Pure-play AI names are largely private or capped-profit vehicles risk sits more in private markets. The bottlenecks direction | Capacity was overbuilt ahead of demand glut. | Supply is the constraint: GPU-poor, power-poor, and now community / permitting pushback.